Hierarchical Data Format 5 is a popular file format for storing and managing large amounts of data. It is the format used by NASA for their ACOS and OCO-2 data products, which both contain (among other things) column-averaged CO2 in units of dry-air mole fraction (Xco2). This tutorial demonstrates how to extract the average daily Xco2 value – and total reading count per day – from the HDF5 files into a CSV file for analysis in Excel or Gnumeric.
These linux commands will download the entire ACOS Level 2 Standard v3.3 data set (48GB):
mkdir /data/ACOS_L2S.3.3/
wget --mirror -c -nd -P /data/ACOS_L2S.3.3/ ftp://aurapar1u.ecs.nasa.gov/ftp/data/s4pa/GOSAT_TANSO_Level2/ACOS_L2S.3.3/
And the OCO-2 Level 2 Standard v7r data set (925GB in Feb 2016):
mkdir /data/OCO2_L2_Standard.7r/
wget --mirror -c -nd -P /data/OCO2_L2_Standard.7r/ ftp://oco2.gesdisc.eosdis.nasa.gov/data/s4pa/OCO2_DATA/OCO2_L2_Standard.7r/
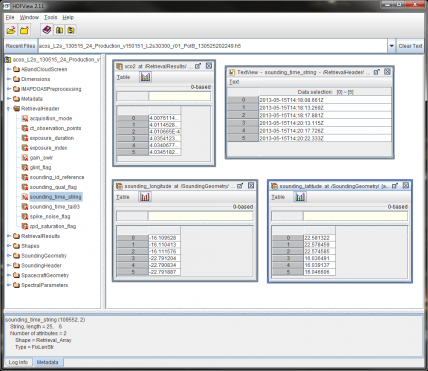
HDF5 files are a self-contained database. To find out which data field names you need to extract you can open one of the .h5 files in HDFView and explore the data.

The fields I need in ACOS are:
RetrievalHeader/sounding_time_string
SoundingGeometry/sounding_latitude
SoundingGeometry/sounding_longitude
RetrievalResults/xco2
They are named differently in OCO-2:
RetrievalHeader/retrieval_time_string
RetrievalGeometry/retrieval_latitude
RetrievalGeometry/retrieval_longitude
RetrievalResults/xco2
Next install H5PY with this command on CentOS Linux 6:
sudo yum install h5py
Or Ubuntu Linux:
sudo apt-get install python-h5py
Finally, use this Python script to extract the useful data from those HDF5 files into a CSV file:
#!/usr/bin/python

import h5py, numpy, os, datetime

co2points = {}

filedir = "/data/ACOS_L2S.3.3"
for filename in os.listdir(filedir):
    if filename.endswith(".h5"):
        infile = h5py.File(os.path.join(filedir,filename),"r")
        time_string = infile["RetrievalHeader"]["sounding_time_string"][0:] # [2015-03-23T01:33:25.724Z]
        latitude = infile["SoundingGeometry"]["sounding_latitude"][0:]
        longitude = infile["SoundingGeometry"]["sounding_longitude"][0:]
        xco2 = infile["RetrievalResults"]["xco2"][0:]

        for x in xrange(xco2.shape[0]):
            if xco2[x] == -999999.0 or latitude[x] == -999999.0 or longitude[x] == -999999.0:
                # Ignore bad data
                continue
            else:
                point_name = time_string[x][0:10]

                if (point_name) in co2points:
                    co2points[point_name].append(xco2[x])
                else:
                    co2points[point_name] = [xco2[x]]
        infile.close()

filedir = "/data/OCO2_L2_Standard.7r"
for filename in os.listdir(filedir):
    if filename.endswith(".h5"):
        infile = h5py.File(os.path.join(filedir,filename),"r")
        time_string = infile["RetrievalHeader"]["retrieval_time_string"][0:]
        latitude = infile["RetrievalGeometry"]["retrieval_latitude"][0:]
        longitude = infile["RetrievalGeometry"]["retrieval_longitude"][0:]
        xco2 = infile["RetrievalResults"]["xco2"][0:]

        for x in xrange(xco2.shape[0]):
            if xco2[x] == -999999.0 or latitude[x] == -999999.0 or longitude[x] == -999999.0:
                # Ignore bad data
                continue
            else:
                point_name = time_string[x][0:10]

                if (point_name) in co2points:
                    co2points[point_name].append(xco2[x])
                else:
                    co2points[point_name] = [xco2[x]]
        infile.close()

outfile = file("acos_oco2_daily.csv","w")
outfile.write("Date, Average Xco2, Reading Count\n")

for co2point in sorted(co2points.iterkeys()):
    count = str(len(co2points[co2point]))
    average = str(numpy.mean(co2points[co2point]))
    outfile.write(co2point+", "+average+", "+count+"\n")

outfile.close()
Download acos_oco2_daily_csv.py
You should now have a new file called acos_oco2_daily.csv that looks like this:
Date, Average Xco2, Reading Count
2009-03-31, 0.000385072027497, 17
2009-04-01, 0.000385452485908, 492
2009-04-02, 0.000386389267112, 967
2009-04-03, 0.000386609486304, 640
…
Download acos_oco2_daily.csv
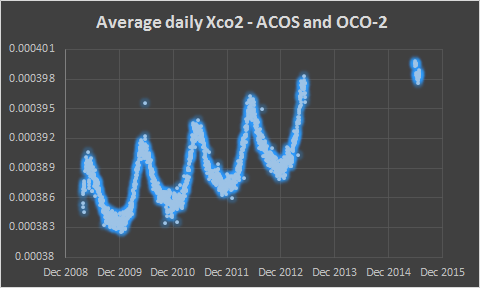
The ACOS data set extends from April 2009 to May 2013. OCO-2 began collecting observations in September 2014.

In this chart you can see the gap between ACOS and OCO-2 data as well as a general trend of increasing Xco2 with seasonal variation.

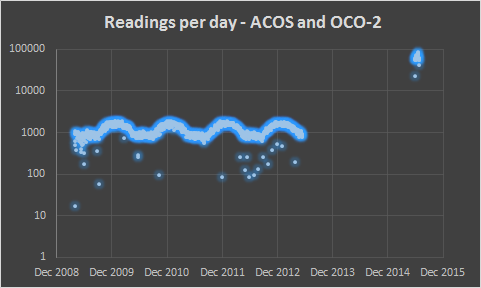
This logarithmic chart shows the difference in readings per day between the two data sets. ACOS contains around 1000 readings per day, compared to 60,000 per day from OCO-2. This extra level of detail will provide a clearer picture of CO2 sources and sinks.

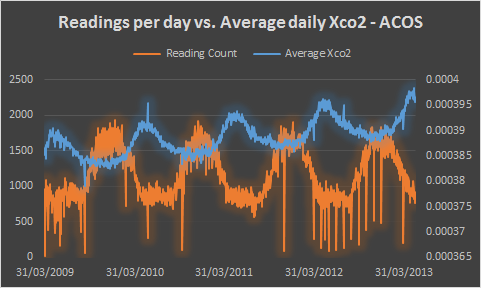
This chart appears to show an inverse correlation between readings per day and average daily Xco2 in the ACOS data (OCO-2 data is excluded), however the correlation is not causation – seasonal changes to vegetation are responsible for the yearly variation in CO2, while the number of readings is restricted by surface ice coverage and cloud cover interfering with the measurement instruments.