NASA JPL’s Orbiting Carbon Observatory 2 (OCO-2) was launched into sun-synchronous orbit around the Earth on July 2, 2014. It carries 3 grated spectrometers for measuring the spectrum of sunlight reflected off the surface of the earth, which is used to calculate the average concentration of Carbon Dioxide in the column of atmosphere beneath the satellite (XCO2). It takes 16 days to provide full coverage of the Earth’s surface.
I am using the R packages datadr and Trelliscope from the DeltaRho project (formerly called Tessera.io) to explore and visualise the XCO2 observations from the OCO-2 Level 2 Lite version 7R data product.
The first step is downloading OCO-2 Level 2 Lite version 7R with wget.
wget --mirror -c -nd ftp://oco2.gesdisc.eosdis.nasa.gov/data/s4pa/OCO2_DATA/OCO2_L2_Lite_FP.7r/
The data is in NetCDF-4 format. It currently runs from September 2014 to August 2016, totalling 70GB. These files contain a lot of variables I’m not interested in, so the next step is reading them one by one in R and saving just what I need to a CSV file.
library(ncdf4)

inputfiles <- list.files(path="OCO2_L2_LITE_FP.7r", pattern="*.nc4$", full.names=T, recursive=FALSE)

for (i in 1:length(inputfiles)) {
    print(paste("reading",inputfiles[i]))
    nc <- nc_open(inputfiles[i])
    oneday <- data.frame(
        datetime=strptime(format(ncvar_get(nc,'sounding_id'), scientific=FALSE), "%Y%m%d%H%M%S", tz="UTC"),
        longitude=ncvar_get(nc,'longitude'),
        latitude=ncvar_get(nc,'latitude'),
        xco2=ncvar_get(nc,'xco2'),
        xco2_uncertainty=ncvar_get(nc,'xco2_uncertainty'),
        xco2_quality_flag=ncvar_get(nc,'xco2_quality_flag'),
        warn_level=ncvar_get(nc,'warn_level'),
        operation_mode=ncvar_get(nc,'Sounding/operation_mode'),
        stringsAsFactors = FALSE
    )
    if (i==1) {
        # If this is the first line, write column names.
        write.table(oneday,file='oco2lite.csv', row.names=FALSE, col.names=TRUE, sep=',')
    }
    else {
        write.table(oneday,file='oco2lite.csv', row.names=FALSE, col.names=FALSE, sep=',', append=TRUE)
    }
}
The resulting CSV file is 11GB. To save space it can be compressed to 2.8GB with bzip2.
system("bzip2 oco2lite.csv")
Next import that compressed CSV file into a datadr Local Disk Connection (localDiskConn) with drRead. A localDiskConn is a collection of many R object files on disk containing subsets of your data. By selectively accessing these subset files, datadr allows you to work with a data set that would be too large to load into RAM all at once.
library(datadr)

drRead.csv("oco2lite.csv.bz2", output = localDiskConn("oco2data", autoYes = TRUE))
This has created 2476 object files on the disk, a total of 8.5GB.
Finally I can create a Distributed Data Frame (ddf) pointing to that folder of object files. A ddf is the object type required for all datadr functions.
oco2Ddf <- ddf(localDiskConn("oco2data"))
The first thing I have to do before I can run other datadr functions, is create a parallel CPU cluster. Set this to the number of cores or threads available on your CPU.
library(parallel)

options(defaultLocalDiskControl = localDiskControl(makeCluster(8)))
If you are using a graphical R environment such as RStudio or RStudio-Server you might experience random connection errors from the parallel worker threads, and you should run R from the terminal instead.
Now I can use updateAttributes to calculate the summary statistics for the data set. This step is required before some of the datadr functions can be used.
oco2Ddf <- updateAttributes(oco2Ddf)
summary(oco2Ddf)

         datetime                longitude
 ------------------------  ----------------------
       levels : 10000+      missing :           0
      missing : 0               min :        -180
    > freqTable head <          max :         180
 2015-10-08 01:14:32 : 72      mean :    2.816472
 2015-10-08 01:14:33 : 72   std dev :    102.5894
 2015-10-08 01:15:33 : 72  skewness : -0.09390735
 2015-10-08 01:23:06 : 72  kurtosis :    1.837646
 ------------------------  ----------------------
        latitude                 xco2
 ----------------------  --------------------
  missing :           0   missing :         0
      min :   -64.99997       min :  225.7838
      max :    81.88293       max :  625.6877
     mean :    5.643119      mean :  399.1645
  std dev :    29.30803   std dev :  3.356099
 skewness : -0.05699358  skewness : 0.2259898
 kurtosis :    2.087471  kurtosis :  18.06831
 ----------------------  --------------------
    xco2_uncertainty       xco2_quality_flag
 -----------------------  --------------------
  missing :            4   missing :         0
      min : 2.304965e-08       min :         0
      max :     13.69389       max :         1
     mean :    0.4887531      mean : 0.4006167
  std dev :    0.1914053   std dev : 0.4900234
 skewness :     4.958372  skewness : 0.4056268
 kurtosis :     160.1617  kurtosis :  1.164533
 -----------------------  --------------------
      warn_level           operation_mode
 ---------------------  ---------------------
  missing :          0   missing :          0
      min :          0       min :          0
      max :         19       max :          3
     mean :   11.02829      mean :  0.7906012
  std dev :   5.031467   std dev :  0.4402875
 skewness : -0.4265078  skewness : -0.7705691
 kurtosis :   2.206708  kurtosis :   4.125469
 ---------------------  ---------------------
The datetime column has been interpreted as a string of characters instead of a POSIXct date/time object. That’s OK for now.
I will begin visual data exploration by making a plot of data counts by latitude and longitude hexagonal bins with drHexbin to see if it reflects the expected output from OCO-2.
hexbin1 <- drHexbin("longitude","latitude", data = oco2Ddf, xbins = 360, shape = 0.5)

hexbin::plot(hexbin1,trans = log, inv = exp, style = "colorscale", xlab = "longitude", ylab = "latitude", colramp = hexbin::LinOCS)
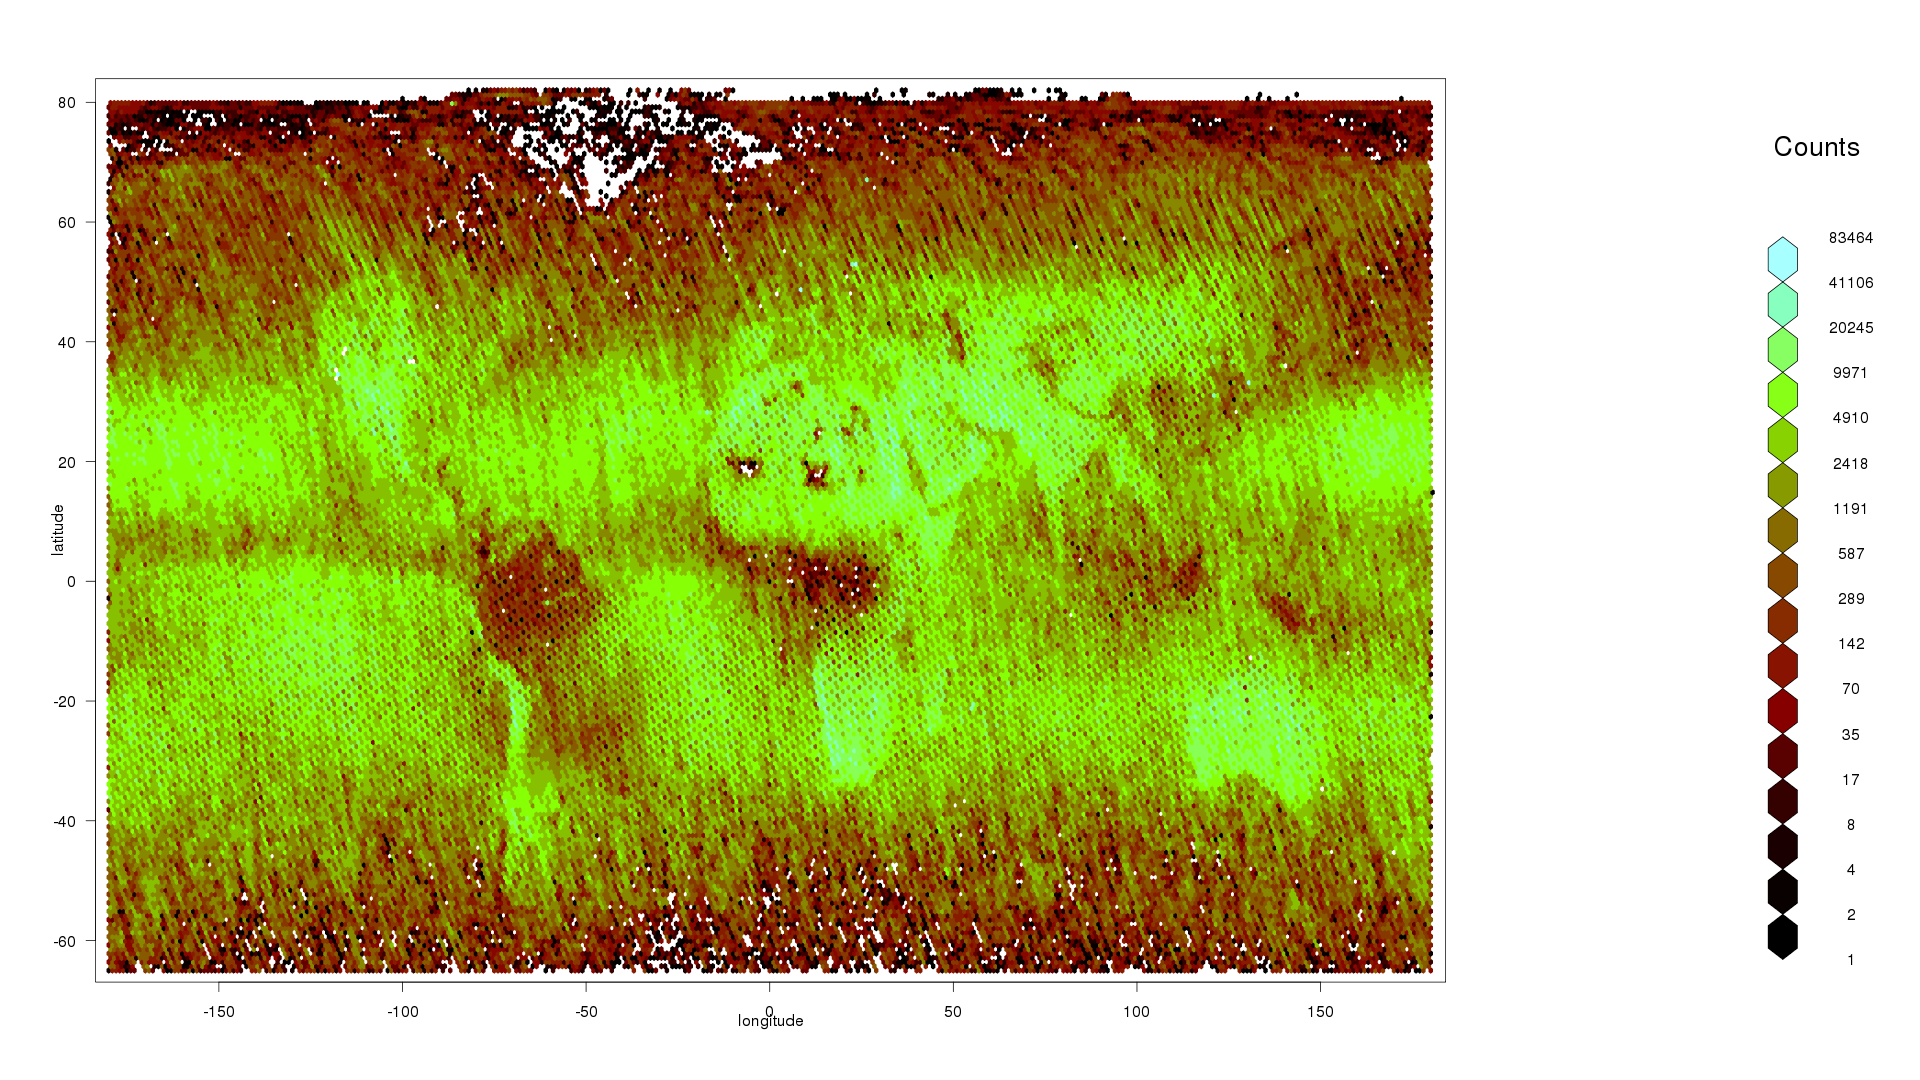 I can see that there are more data points in the middle, less towards the poles, nothing above 80 latitude or below -65 latitude, and a patch of missing data over Greenland. This is consistent with my prior knowledge that OCO-2 does not work when the reflected angle of sunlight is too wide, or over highly-reflective snow and ice.
Next I will calculate the percentiles of the XCO2 observations with drQuantile so I can exclude outliers.
xco2_quant <- drQuantile(oco2Ddf, var = "xco2", tails = 1)
 Because my computer has a solid-state drive, datadr is able to read and write data fast enough to use all the cores on my CPU. A slower mechanical hard disk might not be able to benefit from this many cores.
head(xco2_quant)

   fval        q
1 0.000 225.7838
2 0.005 390.1607
3 0.010 391.8405
4 0.015 392.6404
5 0.020 393.1203
6 0.025 393.4803

tail(xco2_quant)

     fval        q
196 0.975 405.8785
197 0.980 406.3185
198 0.985 406.9184
199 0.990 407.8382
200 0.995 410.0379
201 1.000 625.6877

plot(xco2_quant)
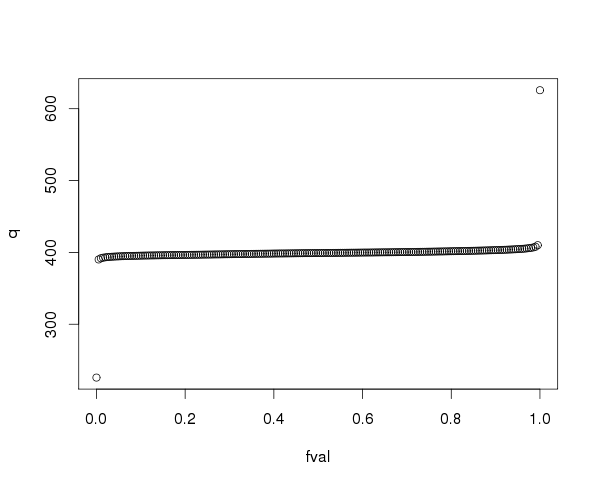 99.5% of the XCO2 values are between 390.2098 and 410.1523 parts per million (PPM). I will use 390 and 410 as the minimum and maximum for my colour scale to plot the XCO2 values for one whole day to see if it looks correct.
xco2_min <- 390
xco2_max <- 410

xco2Subset <- drSubset(oco2Ddf, subset = as.Date(datetime) == as.Date("2015-03-02"), select = c("longitude", "latitude", "xco2") )

colour_palette <- c("#03006d","#02008f","#0000b6","#0001ef","#0000f6","#0428f6","#0b53f7","#0f81f3","#18b1f5","#1ff0f7","#27fada","#3efaa3","#5dfc7b","#85fd4e","#aefc2a","#e9fc0d","#f6da0c","#f5a009","#f6780a","#f34a09","#f2210a","#f50008","#d90009","#a80109","#730005")

library(ggplot2)

xco2Panel <- function(x) {
    ggplot(x) +
    geom_point(aes(longitude,latitude, colour=pmin(pmax(xco2,xco2_min),xco2_max)),size=2) +
    lims(x = c(-180, 180), y = c(-90, 90)) +
    scale_colour_gradientn(colours=colour_palette) +
    labs(x="longitude", y="latitude", title=NULL, colour="xco2") +
    theme_bw()
}

xco2Panel(xco2Subset)
I used drSubset to extract a custom subset from the ddf. The default subset limit is 500000, which is more than my one-day subsets, however I could increase that limit with the parameter maxRows = 100000000.
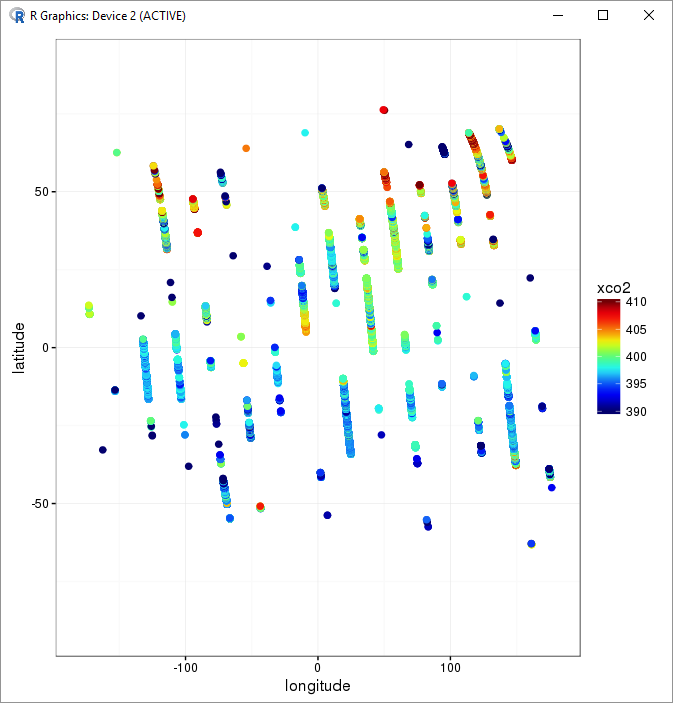
Yes, that looks like the tracks of an orbiting satellite!
The datetime column in my data is a string containing both the date and time. To divide the data into 1-day subsets more efficiently I need to add a new column containing only the date without time. I would also like to convert datetime to POSIXct and add a new column with the mean solar time. To do these I can apply a transformation function to the data with addTransform.
solarTimeFunction <- function(inputDate, longitude) {
    inputTime <- as.numeric(format(inputDate, format = "%H")) + as.numeric(format(inputDate, format = "%M"))/60
    offset <- longitude / 180 * 12
    round((inputTime + offset) %% 24, 1)
}

dateTransform <- function(x) {
    x$datetime <- as.POSIXct(x$datetime, tz="UTC")
    x$day <- as.Date(x$datetime)
    x$solarTime <- solarTimeFunction(x$datetime, x$longitude)
    x
}

oco2Ddf <- addTransform(oco2Ddf,dateTransform)
The transformation is not applied to the entire data set immediately. It will be applied dynamically to any subset I request, for example if I look at the first item in the ddf I can see the new columns day and solarTime.
oco2Ddf[1]

[[1]]
$key
[1] 1023

$value
             datetime longitude latitude     xco2
1 2015-07-09 08:24:50  71.09558 32.37447 396.9056
2 2015-07-09 08:24:52  71.07521 32.50988 397.0431
3 2015-07-09 08:24:52  71.06969 32.50787 397.8902
4 2015-07-09 08:24:52  71.06949 32.49757 397.9942
5 2015-07-09 08:24:52  71.06364 32.50586 398.3778
  xco2_uncertainty xco2_quality_flag warn_level
1        0.3836549                 1         16
2        0.3926561                 1         16
3        0.4699063                 1         16
4        0.4677426                 1         16
5        0.4792997                 1         16
  operation_mode        day solarTime
1              1 2015-07-09  13.1
2              1 2015-07-09  13.1
3              1 2015-07-09  13.1
4              1 2015-07-09  13.1
5              1 2015-07-09  13.1
...
Now I can use drAggregate to see how many observations there are for each day.
oco2daily <- drAggregate(~ day, data = oco2Ddf)

library(xts)

oco2daily <- xts(oco2daily$Freq, as.Date(oco2daily$day))

plot(oco2daily)
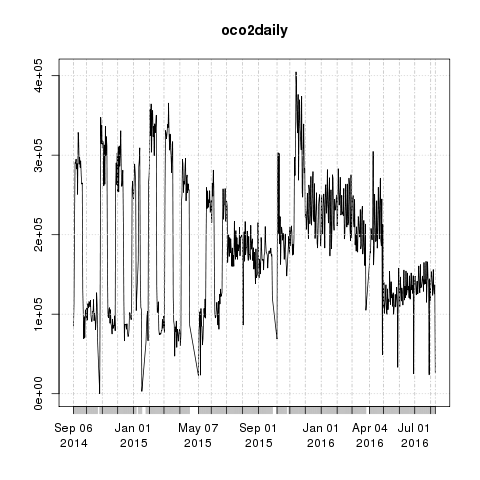 The number of observations per day went up and down for the first 10 months before stabilising around June 2015. This could be due to problems with instrument calibration or a change in how observations were processed.
Next I will plot the number of XCO2 observations by solarTime. Because OCO-2 is in sun-synchronous orbit, it should always cross the equator at the same local solar time.
oco2solarTime <- drAggregate(~ solarTime, data = oco2Ddf)
plot(oco2solarTime)
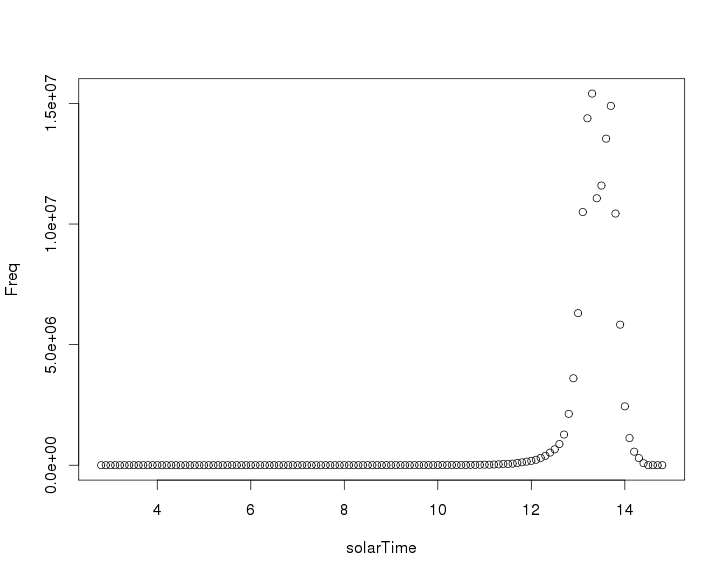 From this plot it looks like the satellite crosses the equator around 1:30pm local solar time.
Some datadr functions are not available until the transformation has been applied to the entire set and the summary statistics have been re-calculated, so it’s time to persist the changes to a new localDiskConn with drPersist.
drPersist(oco2Ddf, output=localDiskConn("oco2Transformed", autoYes = TRUE), overwrite = TRUE)

# Load the new localDiskConn as a ddf.
oco2Ddf <- ddf(localDiskConn("oco2Transformed"))

# Update the summary statistics.
oco2Ddf <- updateAttributes(oco2Ddf)
Another way to persist a transformation is by calling divide to split the data into new subsets. I will divide the data by day, which also creates a new localDiskConn. If you are planning to use divide, you do not need to use drPersist first.
divide(oco2Ddf, by="day", output=localDiskConn("oco2byDay", autoYes = TRUE), overwrite = TRUE, update = TRUE)

oco2Ddf <- ddf(localDiskConn("oco2byDay"))
Including update=TRUE in the divide command automatically updates the summary statistics so I don’t need to call drAttributes this time.
Earlier I extracted data for 1 day with drSubset. Now that I have divided the data by day, I can request the subset for that day much faster by calling its key.
xco2Subset <- oco2Ddf[["day=2016-03-02"]]$value
Trelliscope can produce plots and calculations (called cognostics) for every subset in my data set. I will define a cognostic function, then create a Trelliscope display using my previous plotting function xco2Panel.
library(trelliscope)

xco2Cognostic <- function(x) {
    list(
        xco2_mean = cogMean(x$xco2),
        xco2_range = cogRange(x$xco2),
        xco2_count = cog(length(x$xco2),
        desc = "number of observations")
    )
}

xco2PreFn <- function(x) {
    list(
        xlim = range(-180,180),
        ylim = range(-90,90)
    )
}
xco2Pre <- prepanel(oco2Ddf, prepanelFn = xco2PreFn)
xco2Lims <- setLims(xco2Pre, x = "same", y = "same")

vdbConn(tempfile(), autoYes = TRUE)

makeDisplay(oco2Ddf,
    name = "oco2 trelliscope",
    desc = "oco2 lite",
    panelFn = xco2Panel,
    cogFn = xco2Cognostic,
    width = 400,
    height = 400,
    lims = xco2Lims
)

view()
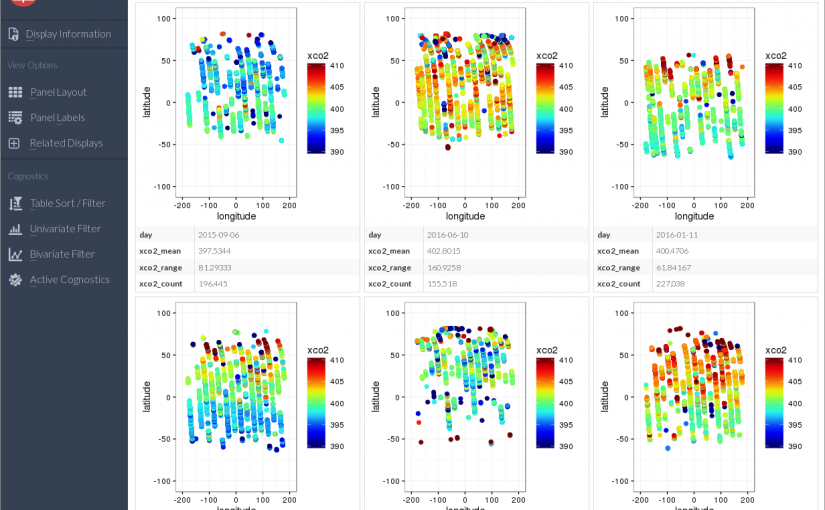
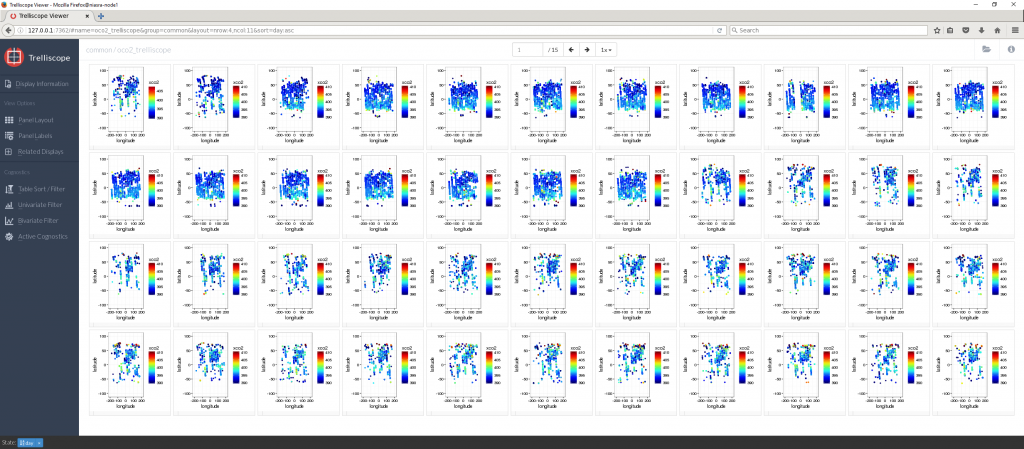
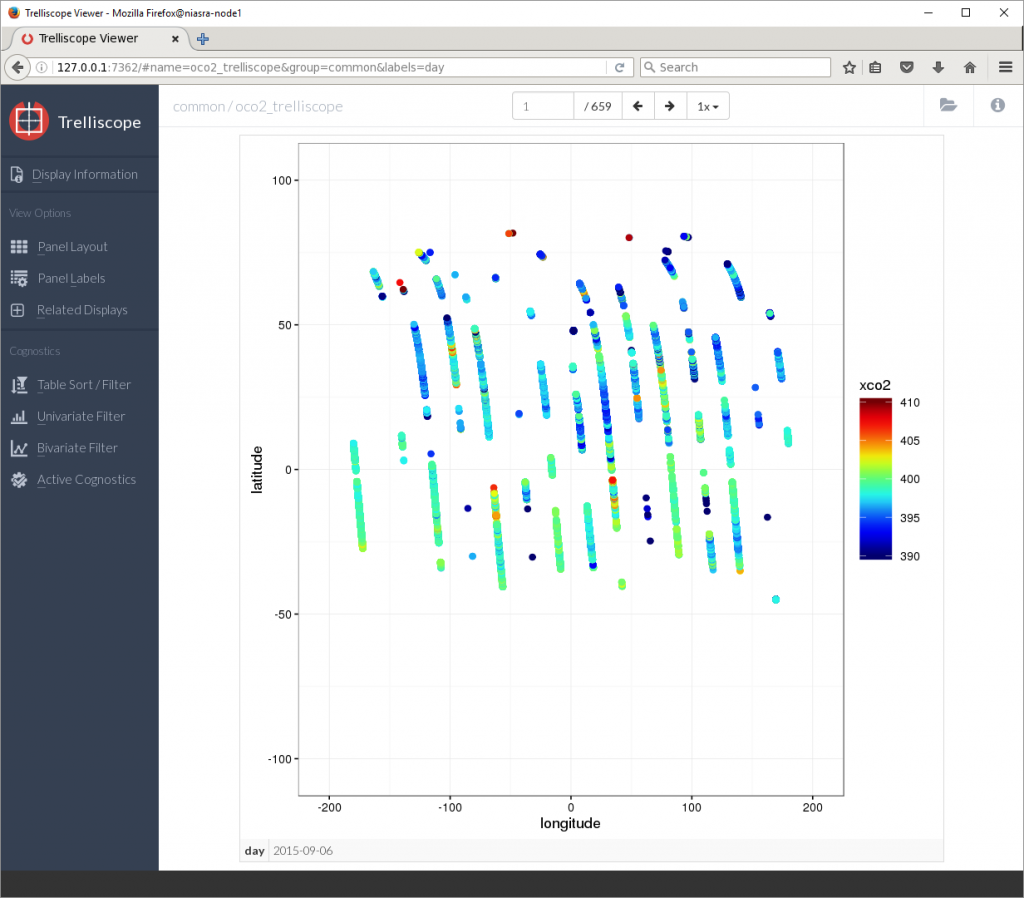 The default view shows the first plot on its own, representing 1 day of XCO2 observations. The buttons above the plot will flip through the next 659 plots one at a time. Clicking on Panel Layout in the left side menu allows me to show more plots at once.
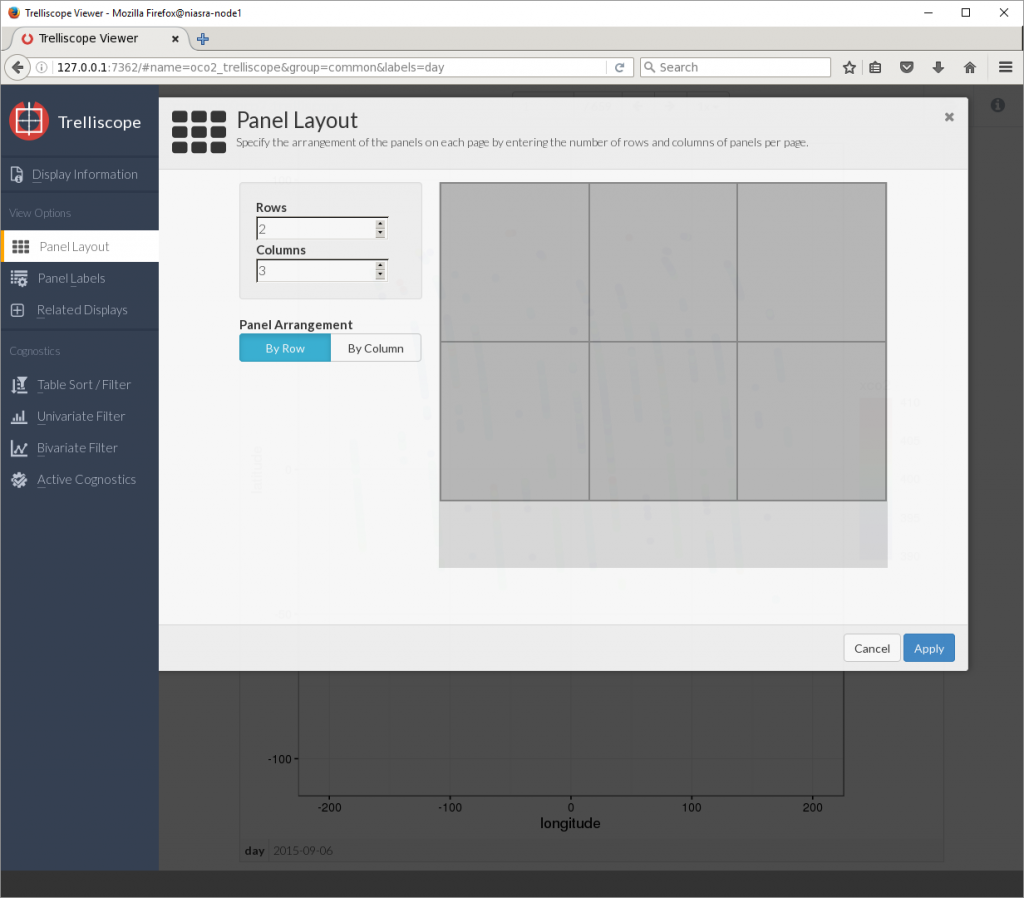
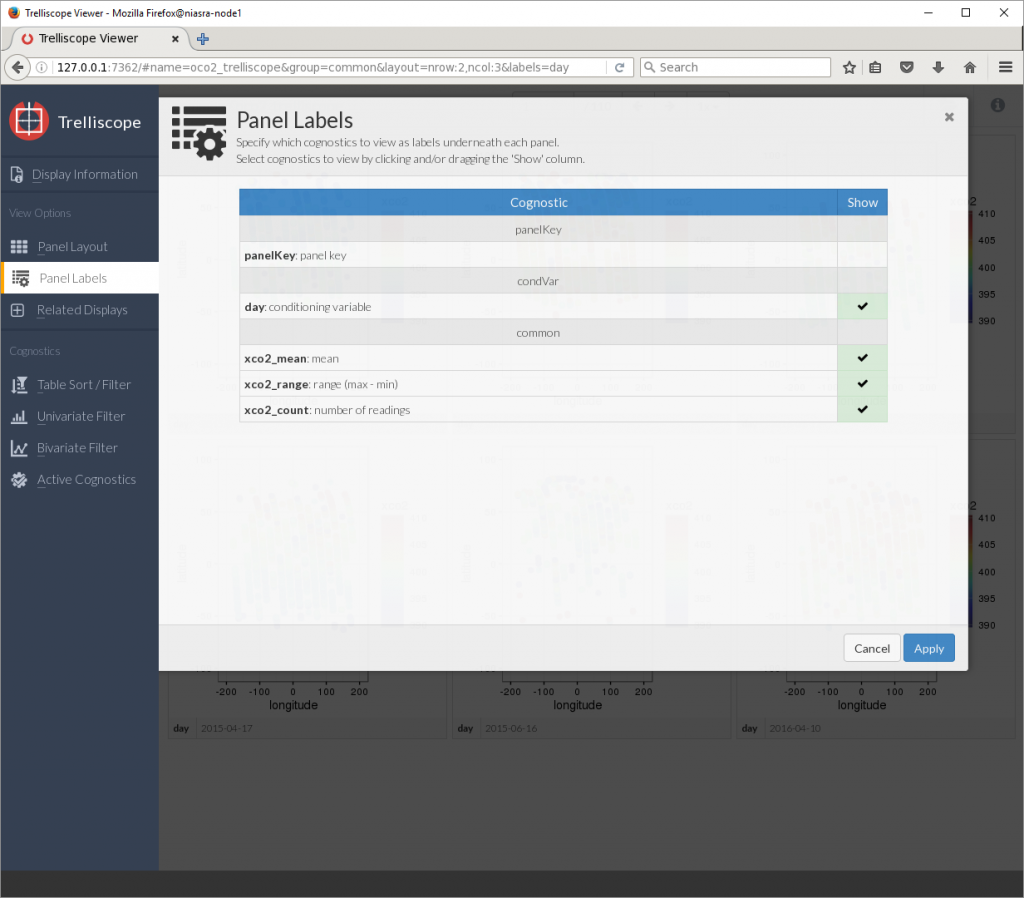
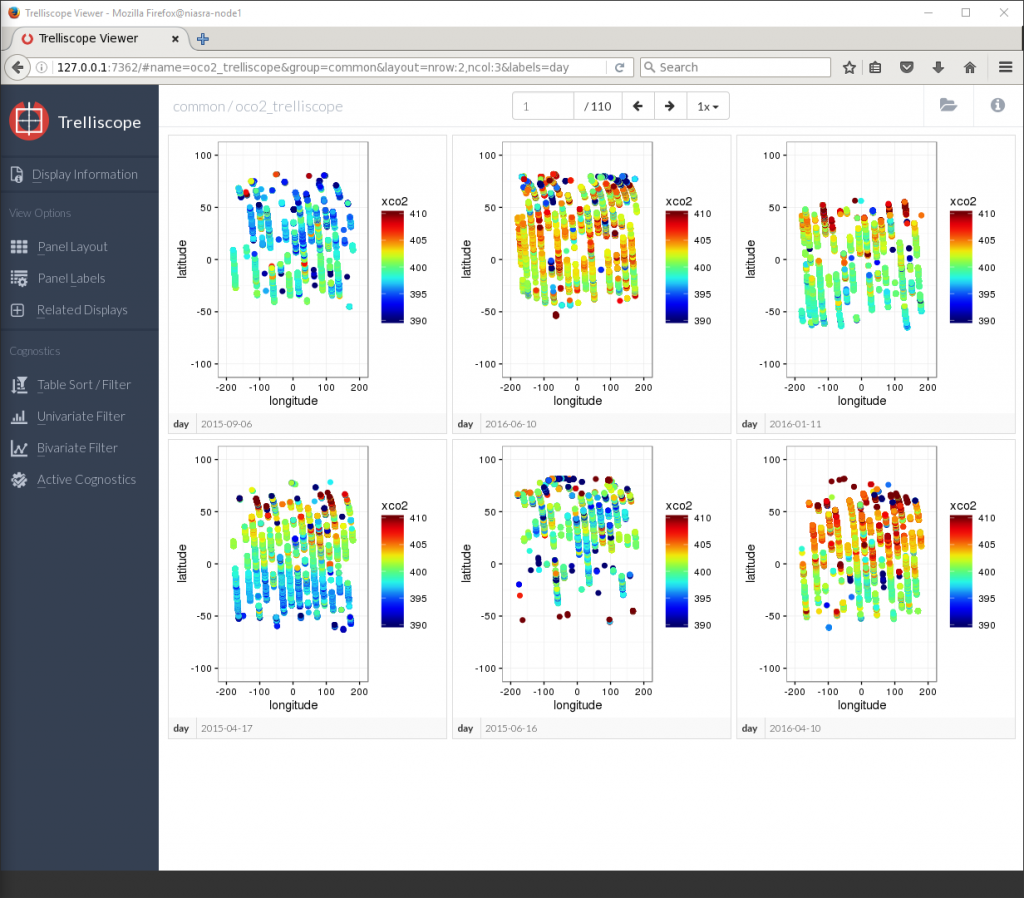 Now there are only 110 pages each containing 6 plots, but they are still lacking the cognostic calculations. The Panel Labels button the left allows me to toggle cognostics on or off.
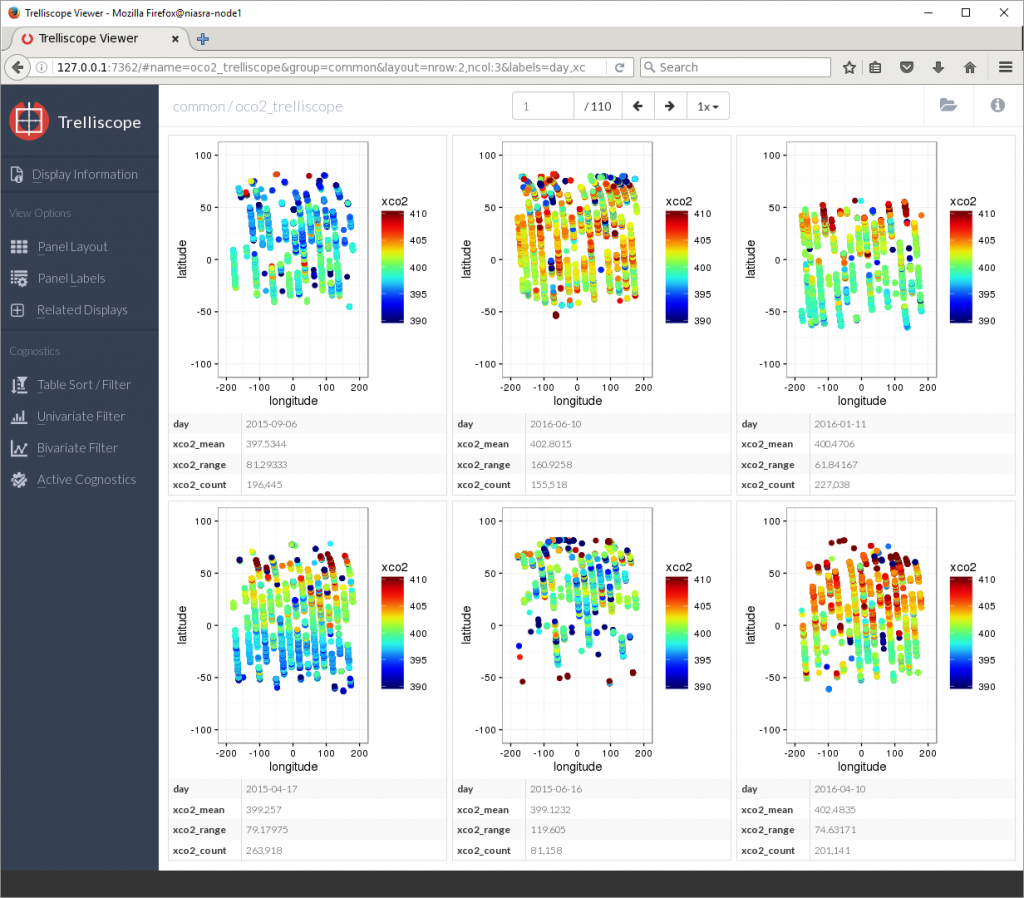 The plots are not in any order right now, due to the nature of parallel computing – results are returned in the order they are finished by the CPU cores.
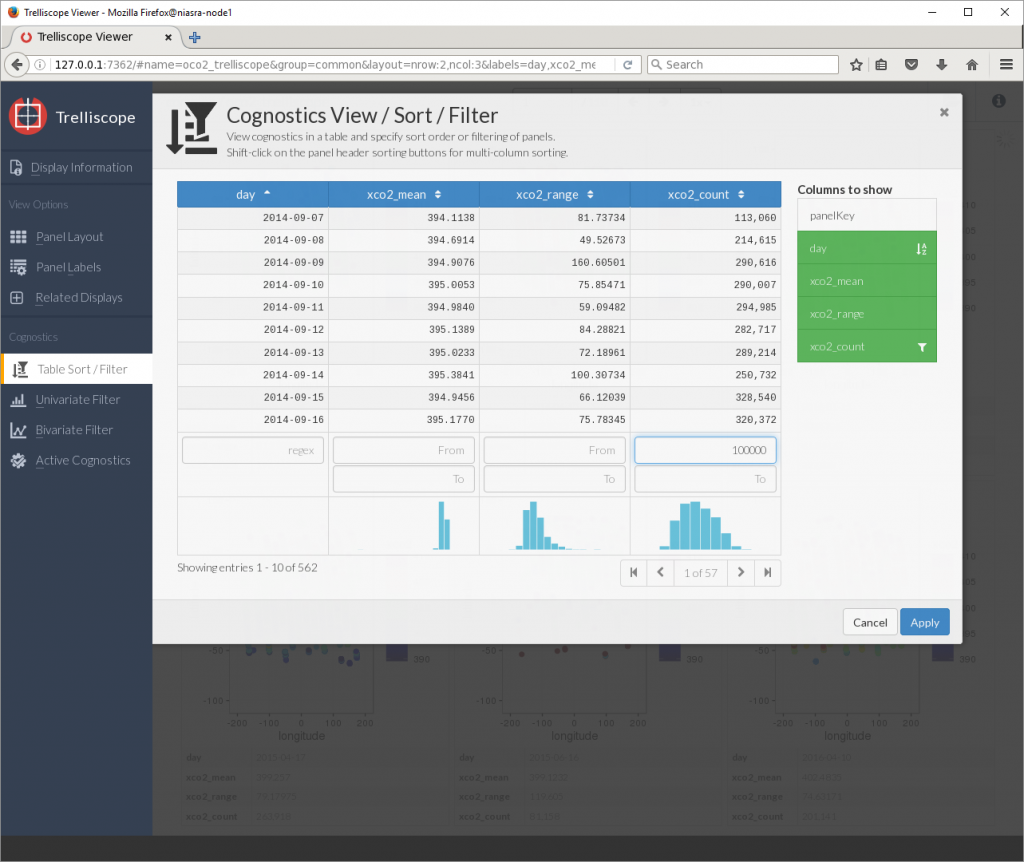
To fix this, the Table Sort/Filter button allows me to sort by any variable or cognostic as well as setting upper and lower limits on which plots to display. Here I am sorting by day and showing only plots with more than 100,000 XCO2 points.
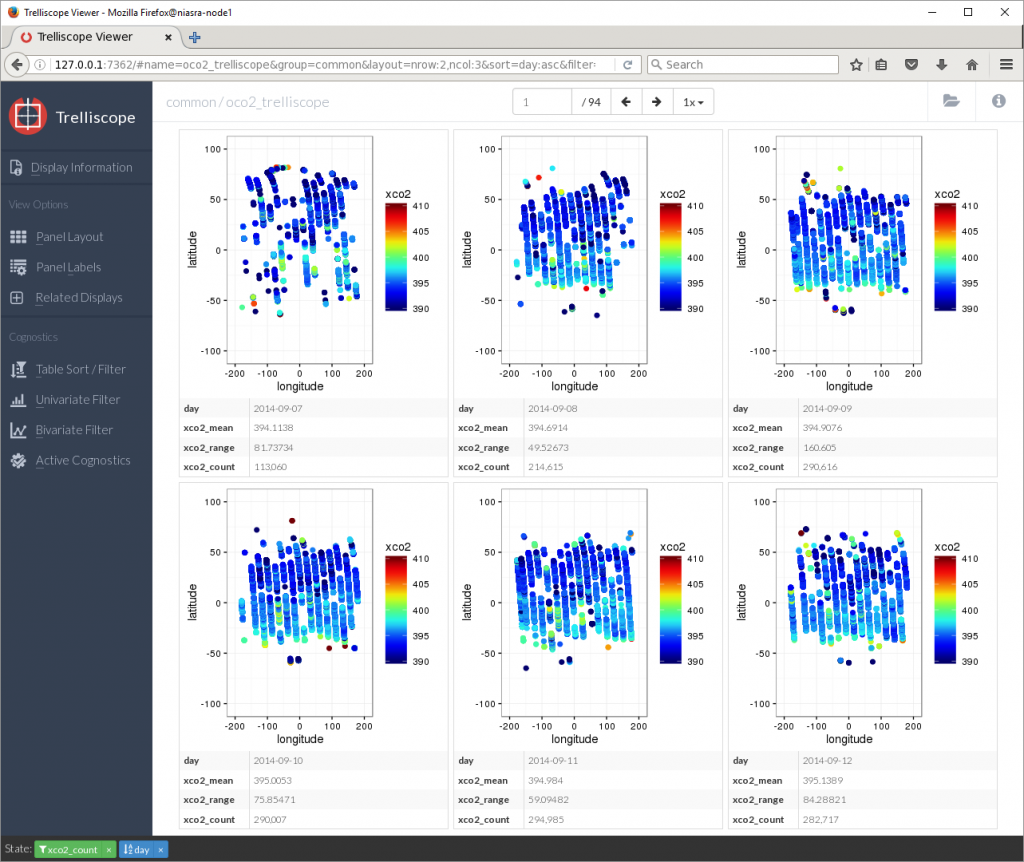 Now I can see that the average XCO2 in September 2014 was around 395 PPM. Let’s jump to the last panel…
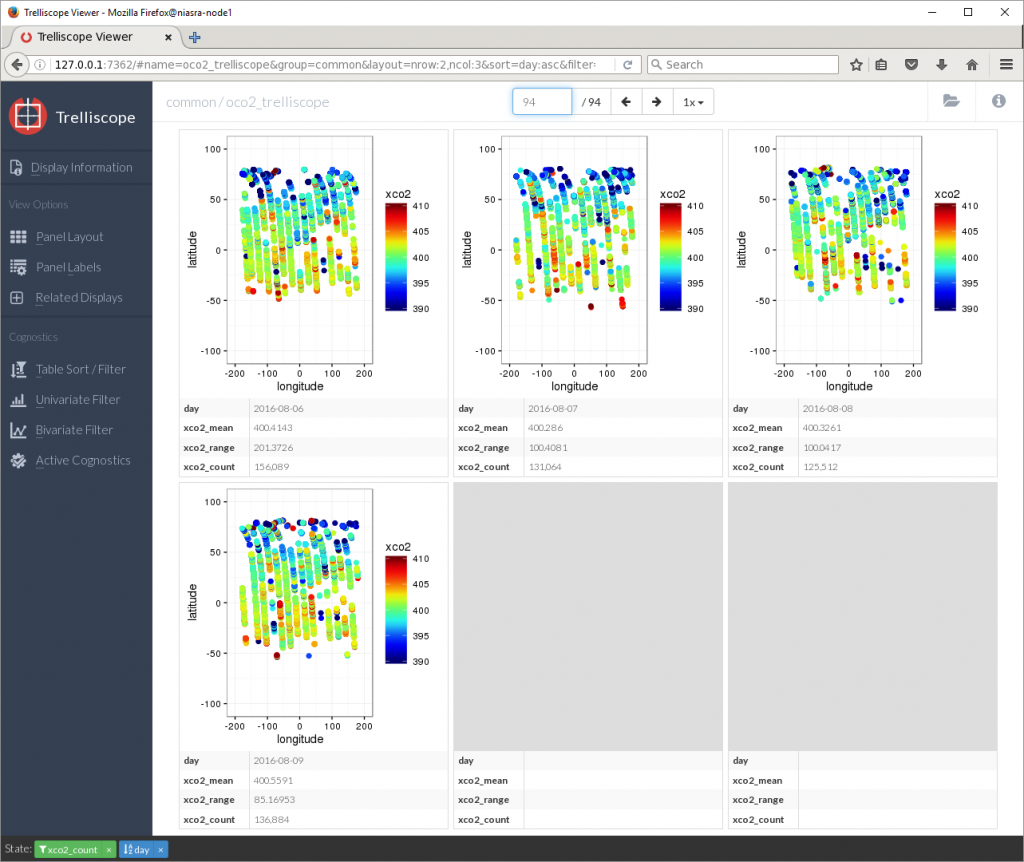 That’s around 400 PPM average in August 2016.
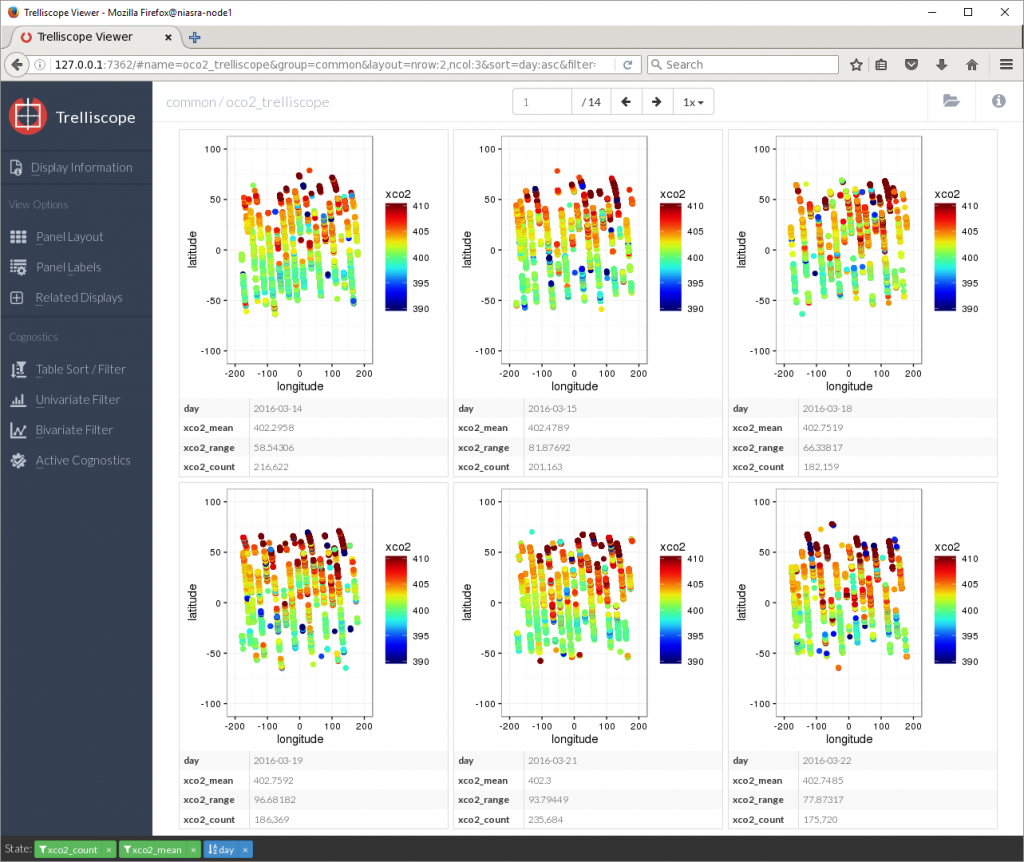
Sorting by xco2_mean in descending order reveals that the days with the highest average XCO2 were in March 2016, nearly 403 PPM.
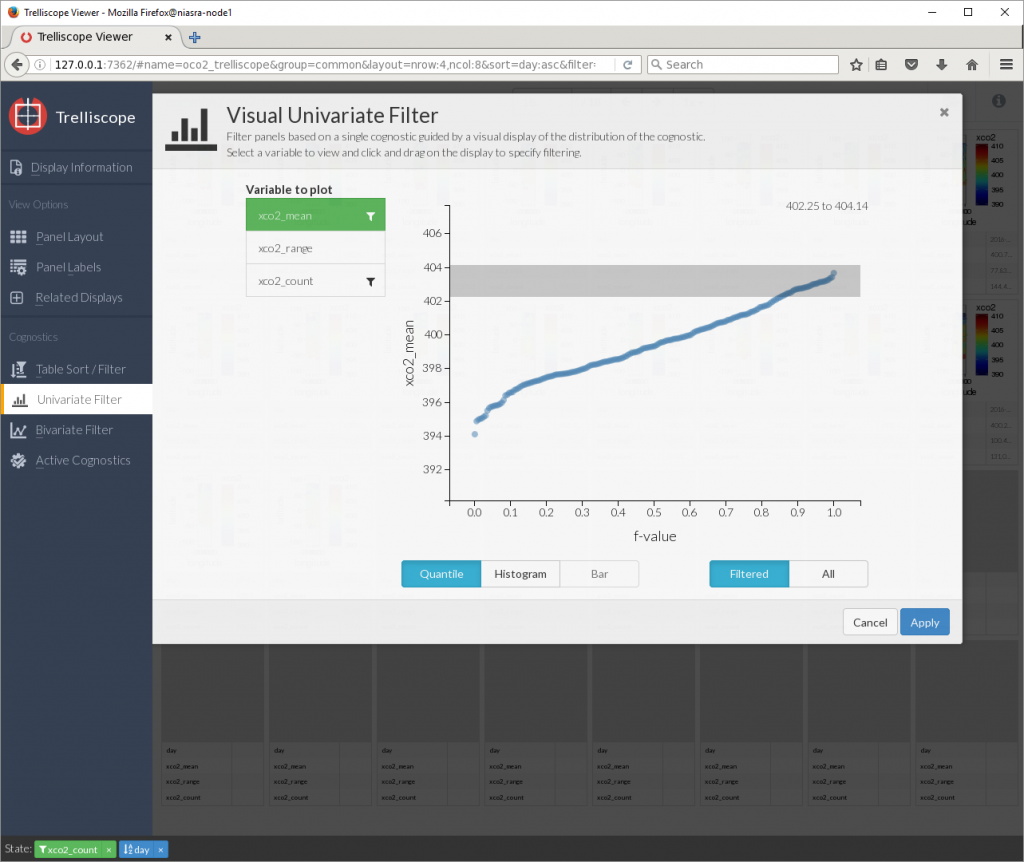 There is also a graphical univariate filter for selecting a range based on one cognostic…
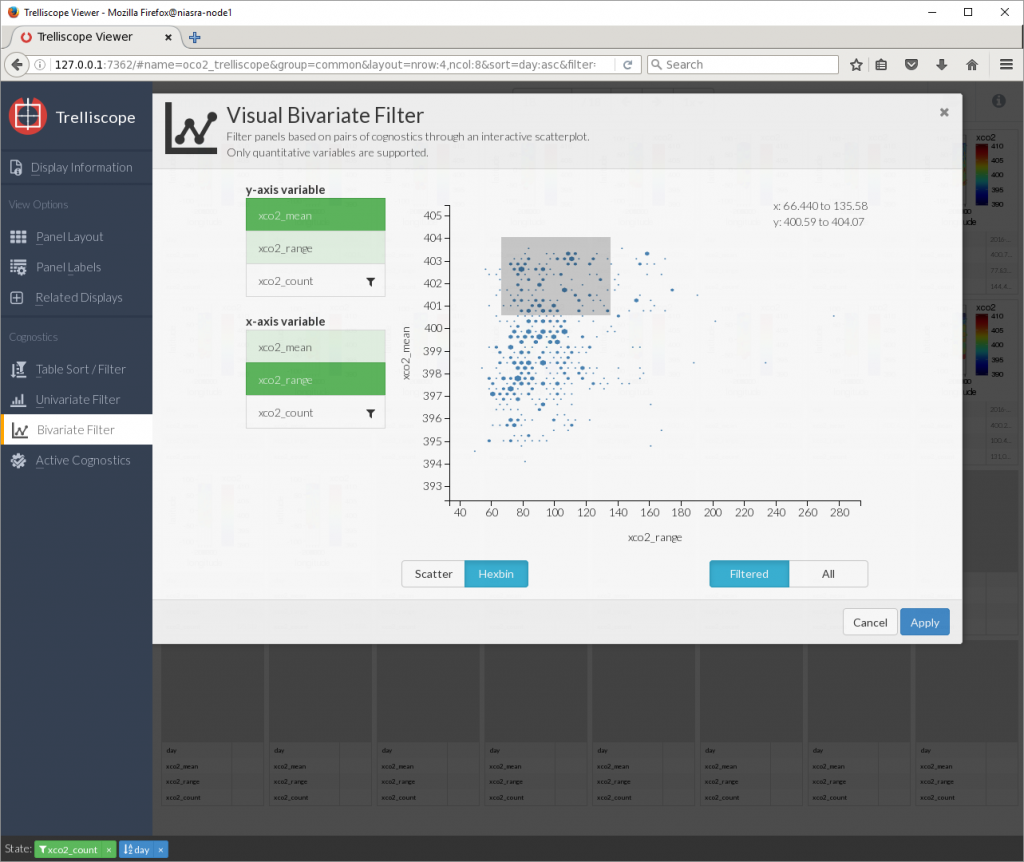
And a bivariate filter for selecting a range by two cognostics.
Viewing many plots together like this can be a good way to identify visual patterns in your data.
The next thing I want to do is produce plots for each day with a rolling 16-day window, since the OCO-2 satellite takes 16 days to provide full coverage of the earth. These plots will be saved to disk to make an animation.
dates <- as.character(seq(as.Date('2014-09-01'), as.Date('2016-07-01'), "days"))

for (selectedDate in dates) {
  startDate <- as.Date(selectedDate)-7
  endDate <- as.Date(selectedDate)+8
  dateKeys <- seq(startDate,endDate, "days")
  dateKeys <- paste0("day=",as.character(dateKeys))

  # extract one-day subsets by date key
  daysubsets <- oco2Ddf[dateKeys]

  # combine the subsets into a single data.frame
  sixteendays <- do.call(
    rbind,
    lapply(
      1:length(daysubsets),
      function(x) {
        tryCatch(
          daysubsets[x][[1]]$value,
          error=function(e) {
            NULL
  })}))

  # create a dummy data.frame if there is no data, e.g. 2015-04-29
  if (is.null(sixteendays)) {
    sixteendays <- data.frame("longitude"=0,"latitude"=0,"xco2"=0)
  }

  g1 <- xco2Panel(sixteendays)
  ggsave(g1,filename = paste0(selectedDate,"_plot.png"), width=16,height=9,dpi=120)
}
This takes a while to finish. Each sixteen day subset contains around 3 million data points.
Now I can close R, and use FFmpeg to combine the plots into a video file to upload to YouTube.
